


Sales Tracker Dashboard
- Dashboard highlighting sales by customer characteristics.
- Fully interactive:
- Can filter using the “Fiscal Year” drop-down in the top right-hand corner of the page.
- Select dashboard elements to filter by customer characteristics (Ex: Selecting the “Travel” slice within the “Industry” pie chart would update all visuals to only show customers within the “Travel” industry).
- Dashboard refreshes automatically on a reoccurring basis.
- Data Source: Excel spreadsheet residing within SharePoint.
Produce Price Tracking Dashboard
- Dashboard highlighting produce prices across time.
- Shared by Sales Management via Microsoft Teams Channel.
- Fully interactive:
- Clicking the produce images dynamically updates the line graph to reflect the selection.
- Dashboard refreshes automatically on a reoccurring basis.
- Data Source: Excel spreadsheet residing within SharePoint.
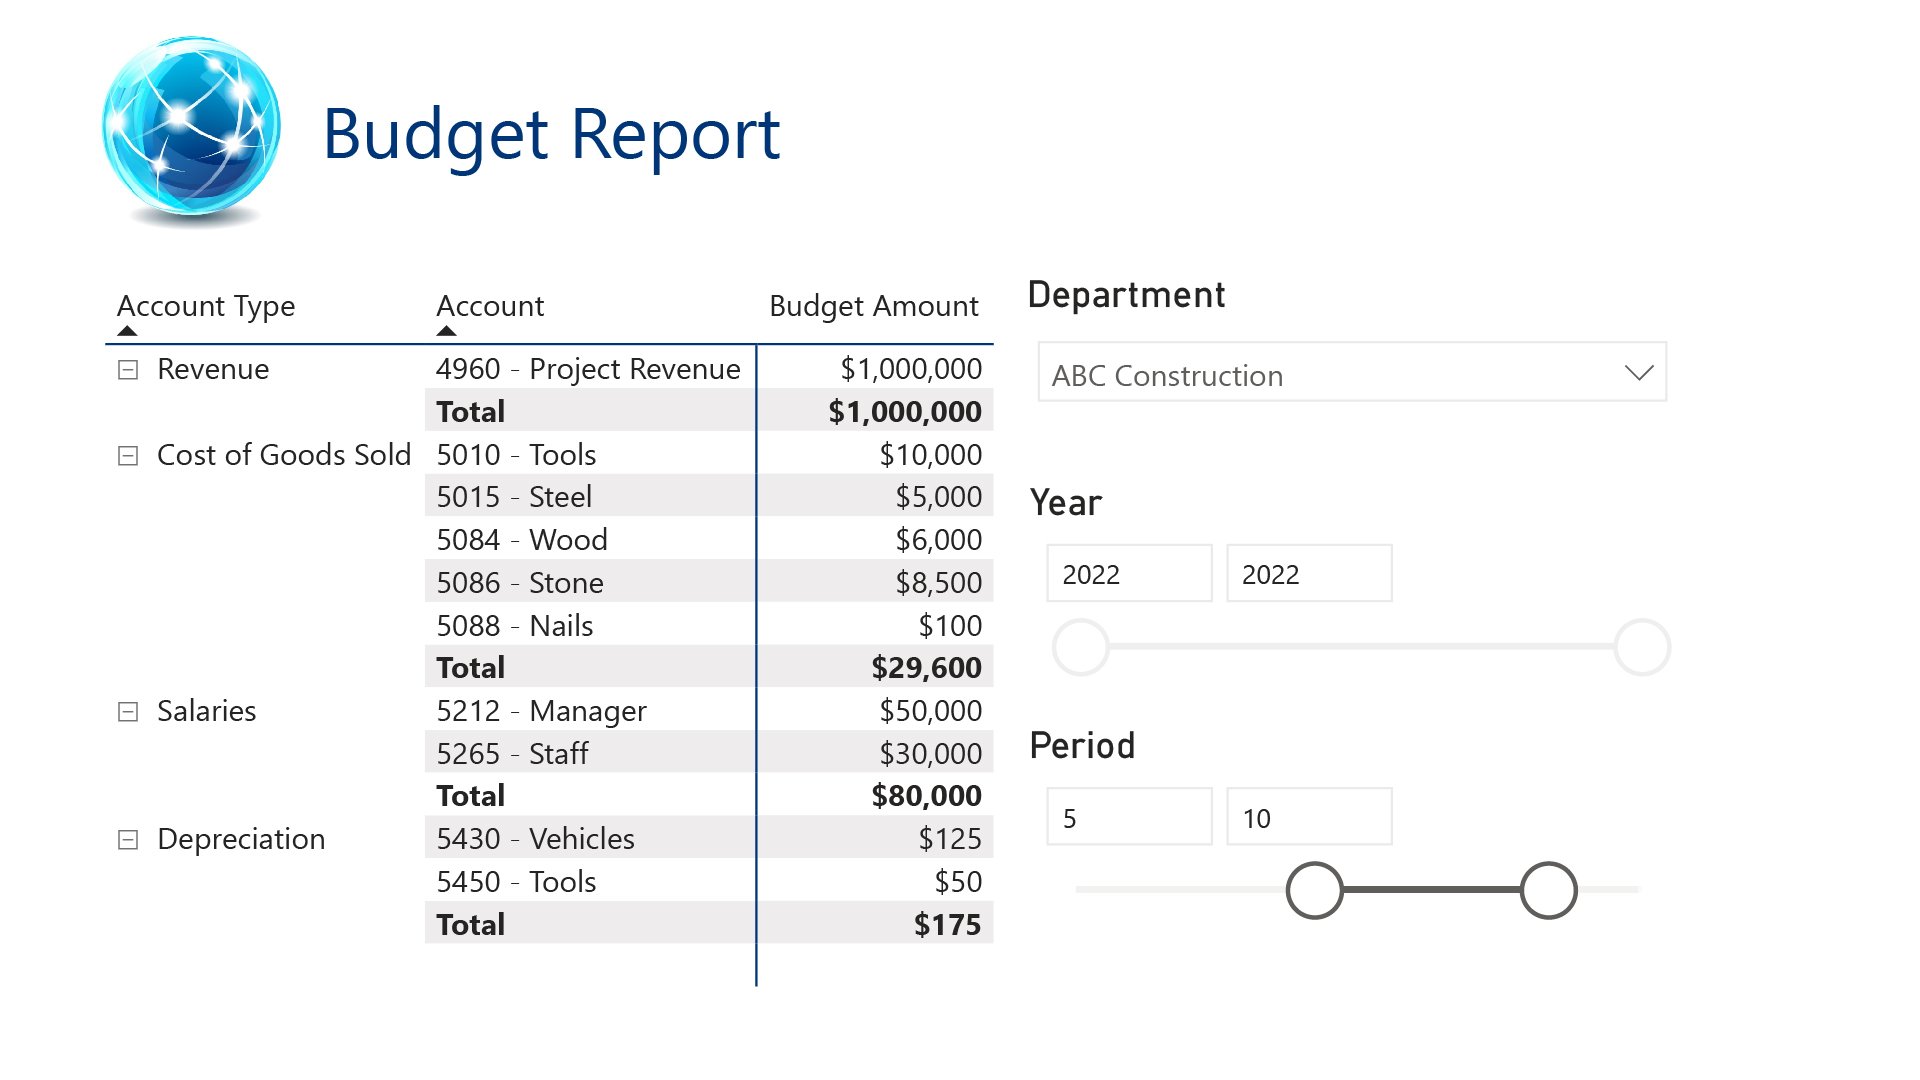
Budget Report
- Dashboard detailing account balances and budget tracking.
- Report is shared with Board of Director by Finance Team instead of emailing Financials.
- Fully interactive:
- Report dynamically updates to reflect selections of “Department”, “Year”, and “Period”
- Dashboard refreshes automatically on a reoccurring basis using live data.
- Refresh times are customizable.
- Data source: Report connects directly to accounting system (ex: Sage 300).
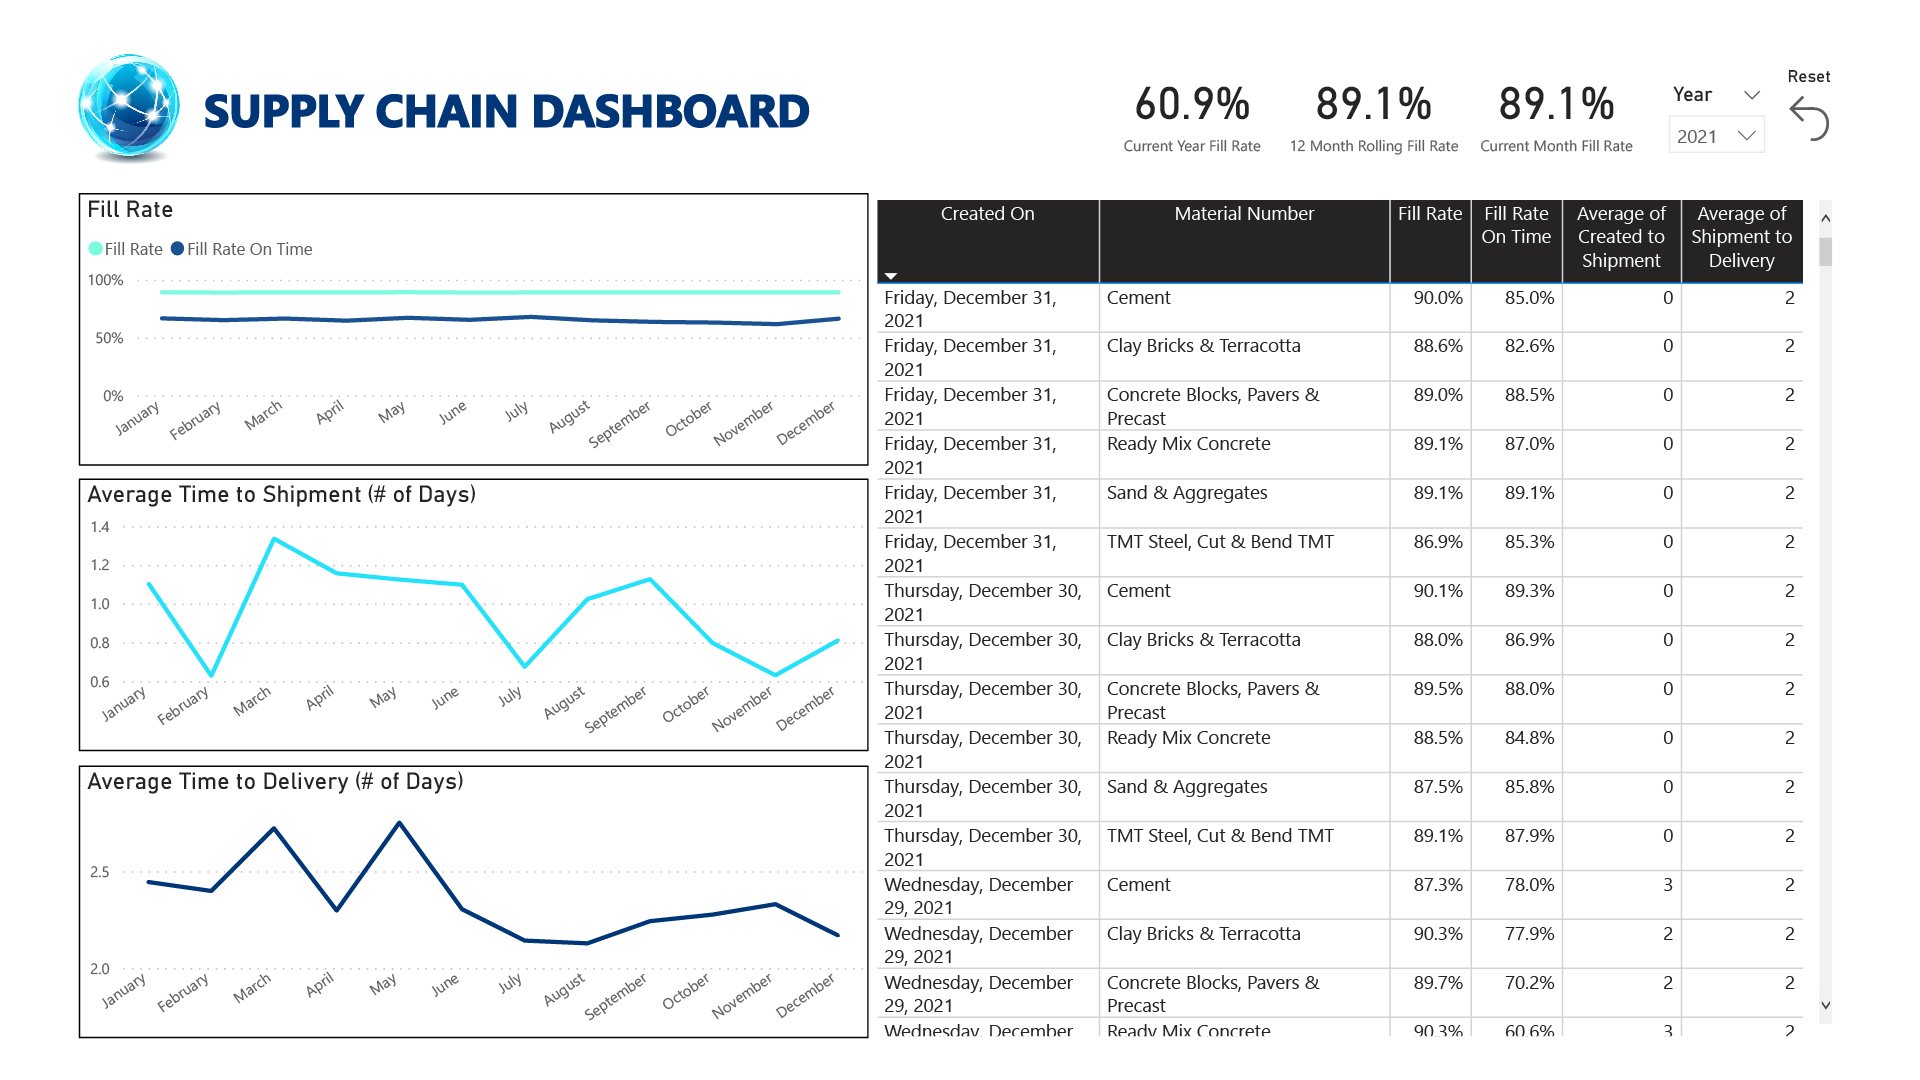
Supply Chain Dashboard
- Dashboard containing supply chain-related metrics across time with a Material detail table.
- Reviewed by Customer Service Management to analyze service delivery.
- Fully interactive:
- Can filter using the “Year” drop-down menu in the top right-hand corner of the page.
- Select dashboard elements to filter by month (Ex: Selecting the “May” point on the “Fill Rate” line chart would update the data table on the right-hand side)
- Refreshes automatically on a reoccurring basis.
- Data source: Excel spreadsheet residing within SharePoint.
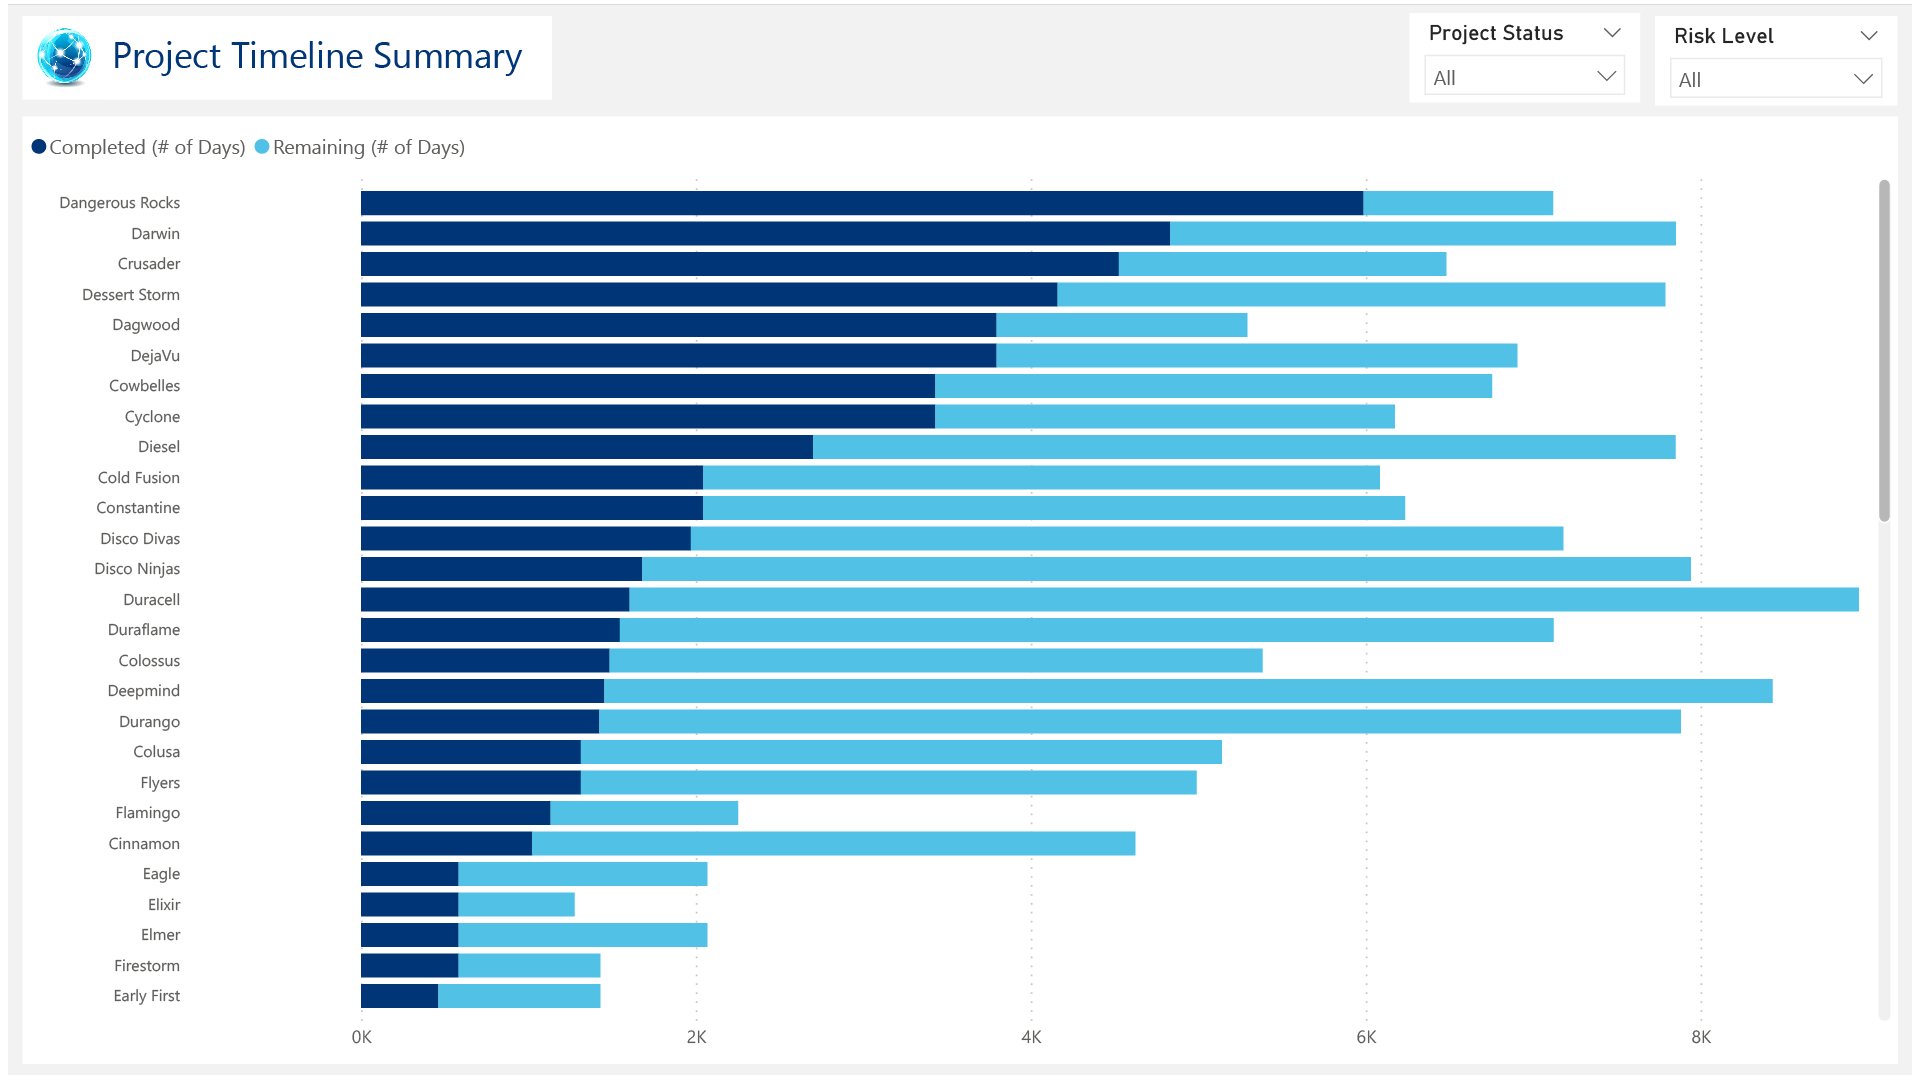
Project Timeline Summary
- Dashboard detailing project timelines (i.e.: number of days elapsed & number of days remaining).
- Essential view for Project Management Team to review commitments and timelines.
- Fully interactive:
- Can filter using the “Project Status” and “Risk Level” drop-down menus in the top right-hand corner).
- Dashboard refreshes automatically on a reoccurring basis.
- Data source: Excel spreadsheet residing within SharePoint.